Reading retention curves from nitride trap energy depth
Trap depth in the nitride layer sets the slope of a retention curve. Here is how to read your bake data with that in mind.

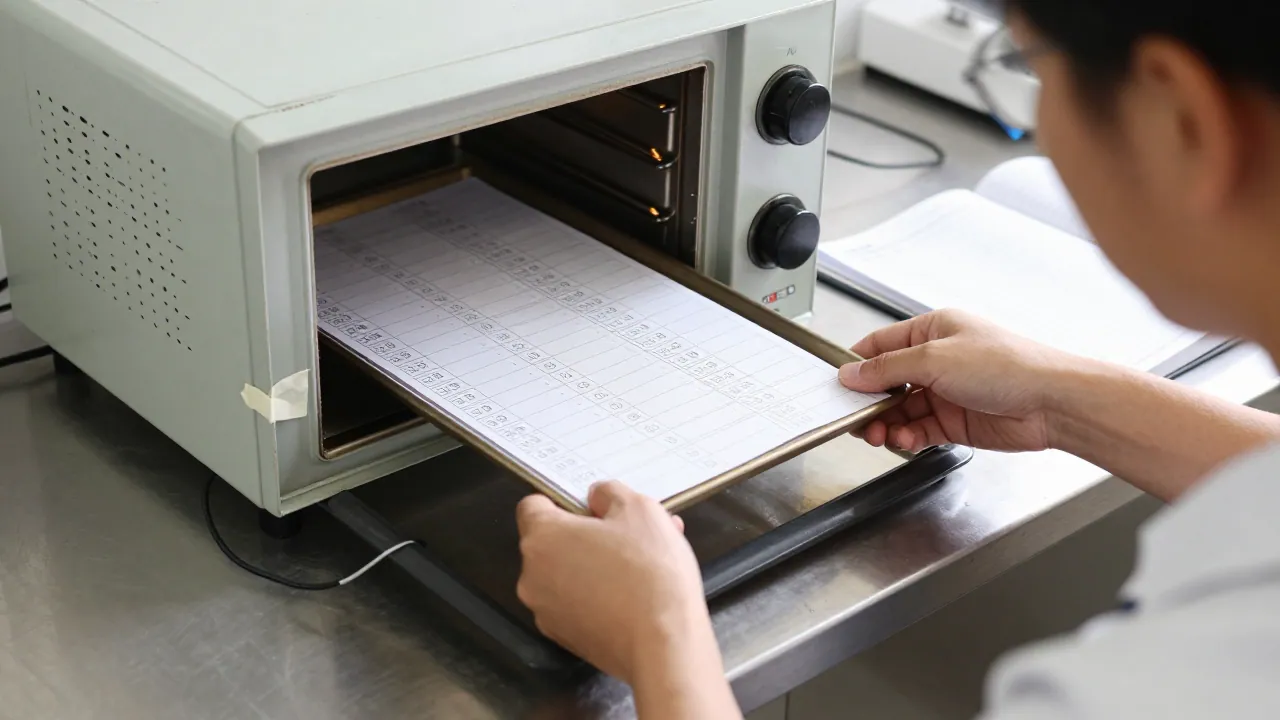
When you pull a retention bake out of the oven and plot the window loss against time, the shape of that curve carries information about where the charge sat in the nitride. Traps at different energy depths release electrons at different rates, and that distribution shows up as a slope. If you have ever stared at two curves that both lose charge but do so at different angles, the difference is often trap depth rather than a processing mistake. Reading retention curves gets easier once you separate the shallow traps from the deep ones and stop treating the whole nitride layer as a single bucket.
What trap depth means in a nitride layer
Charge trap flash stores electrons in a silicon nitride layer rather than in a floating gate. The nitride is full of defects, and each defect sits at a particular energy level below the conduction band. That distance is the trap depth. A shallow trap might sit a few tenths of an electron volt below the band; a deep trap can be more than a volt down. At room temperature, the thermal energy available to an electron is small, so shallow traps empty quickly and deep traps hold on.
This is not a subtle material property that only shows up in specialized labs. It is the main reason two nitride films with the same thickness and the same initial window can behave very differently after a bake. When we compare lots in our own notes, we try to describe the trap distribution rather than just report a single number at the end of the bake.
| Trap depth | Escape behavior | Effect on curve |
|---|---|---|
| Shallow (0.1–0.3 eV) | Empties in minutes to hours at 85°C | Steep early loss |
| Medium (0.3–0.7 eV) | Empties over hours to days | Gradual middle section |
| Deep (0.7–1.2 eV) | Empties over weeks to months | Flat tail |
How trap depth sets the slope
A retention curve is usually plotted as threshold voltage shift against log time. If all traps had the same depth, the curve would be a straight line with a slope set by that depth. In real nitride, the depths are spread out, so the curve bends. Early points are dominated by shallow traps emptying, which makes the first part steep. Later points are dominated by deeper traps, which makes the tail flatter. The overall slope you measure is a weighted average of the depths that are still holding charge at that moment.
This is why a single slope number from a short bake can mislead. If you fit only the first ten hours, you are mostly measuring shallow traps. If you fit only the last hundred hours, you are mostly measuring deep traps. Neither fit tells you the full distribution. When we run bakes for seminars, we try to record several time points across the full window so the bend is visible.
Why the same nitride can look different at 85°C and 125°C
Temperature changes which traps are active. At 85°C, only the shallowest traps empty within a typical bake window. At 125°C, medium-depth traps also empty, so the curve steepens earlier and the apparent slope increases. That does not mean the film changed. It means you are seeing a different slice of the depth distribution. Erase speed and retention trade-offs come from the same physics: deeper traps help retention but can make erase harder.
Reading your own bake data more carefully
When you open a bake result, start by asking what time window the data covers. A bake that runs for twenty-four hours mostly probes shallow and medium traps. A bake that runs for two weeks reaches deeper traps. If you compare two lots with different bake lengths, you may be comparing different parts of the distribution. Our note on setting up a simple retention bake covers how to keep time points comparable.
- Plot on log time so the early emptying is visible.
- Mark where the curve changes slope and ask which trap depths dominate there.
- Record bake temperature next to every curve, because it shifts the active depth window.
- Avoid fitting a single slope until you have seen the full bend.

Common misconceptions
One common mistake is to treat the nitride as a single storage site. It is not. It is a distribution. Another is to assume that a steeper curve always means a worse film. A film with more shallow traps will lose charge early, but that charge may have been easy to erase anyway. The question is whether the depth distribution matches your target window and temperature range. What our spring retention tests showed about sealing layers is a good example of how a material change shifted the curve without changing the initial window.
A third mistake is to compare curves taken at different temperatures without noting it. As we said above, a 125°C bake is not just a faster version of an 85°C bake. It activates deeper traps, so the slope changes. When we check numbers before posting results, the first thing we verify is that the bake temperature and time points are the same across the curves being compared.
What this means for your next bake
If you want to learn about trap depth from your own data, run at least two bake temperatures on the same lot. The difference in curve shape between them tells you how the depth distribution responds to temperature. Keep the time points the same so you can overlay them. And write down the time window, because a curve without its time axis is hard to interpret later. Our monthly online seminar often includes a short session on reading retention plots this way, and newcomers are welcome to bring their own curves.
Questions people ask
Does a steeper retention curve always mean a worse device?
Not necessarily. A steeper early curve means more shallow traps, which lose charge quickly. If those traps are easy to erase and the deep traps hold the final window, the device may still meet its target. The depth distribution matters more than the slope alone.
Why does my curve bend instead of staying straight?
A bend means traps of different depths are emptying at different times. Shallow traps empty first and create a steep section, while deeper traps empty later and flatten the tail. A single-depth trap would give a straight line, but real nitride has a spread.
How long should a bake run to see deep traps?
It depends on temperature. At 85°C, deep traps may need weeks to show clearly. A common approach is to run at least two time windows, such as twenty-four hours and two weeks, so you can see both the early slope and the late tail.